
一、Prometheus 相关概念
1.1、内部存储机制
Prometheus 有着非常高效的时间序列数据存储方法,每个采样数据仅仅占用 3.5byte 左右空间,上百万条时间序列,30 秒间隔,保留 60 天,大概花了 200 多 G(引用官方 PPT)。
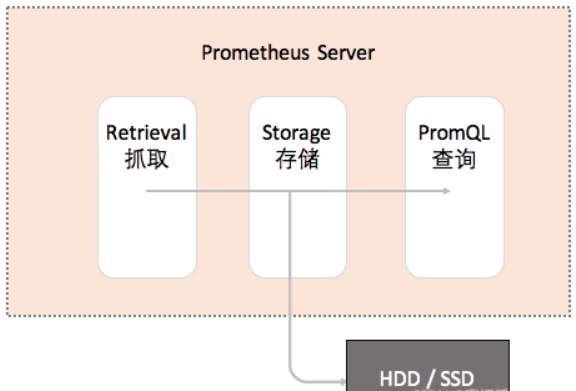
Prometheus 内部主要分为三大块:
Retrieval 是负责定时去暴露的目标页面上去抓取采样指标数据。
Storage 是负责将采样数据写磁盘。
PromQL 是 Prometheus 提供的查询语言模块。
1.2、数据模型
Prometheus 存储的所有数据都是时间序列数据(Time Serie Data,简称时序数据)。时序数据是具有时间戳的数据流,该数据流属于某个度量指标(Metric)和该度量指标下的多个标签(Label)。
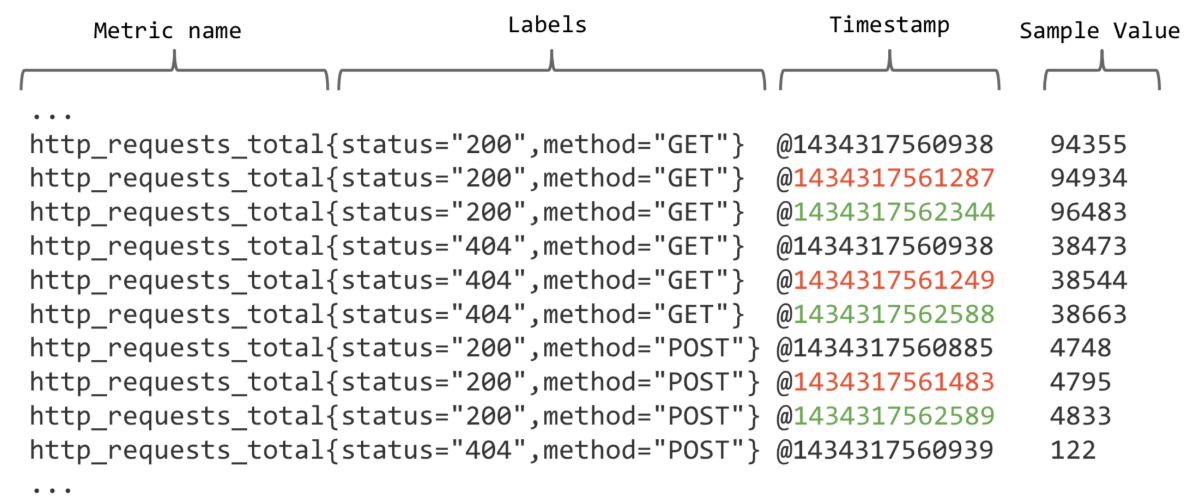
每个 Metric name 代表了一类的指标,他们可以携带不同的 Labels,每个 Metric name + Label 组合成代表了一条时间序列的数据。
在 Prometheus 的世界里面,所有的数值都是 64bit 的。每条时间序列里面记录的其实就是 64bit timestamp (时间戳) + 64bit value (采样值)。
Metric name(指标名称):该名字应该具有语义,一般用于表示 metric 的功能,例如:http_requests_total, 表示 http 请求的总数。其中,metric 名字由 ASCII 字符,数字,下划线,以及冒号组成,且必须满足正则表达式 [a-zA-Z_:][a-zA-Z0-9_:]*。Lables(标签):使同一个时间序列有了不同维度的识别。例如 http_requests_total {method=“Get”} 表示所有 http 请求中的 Get 请求。当 method=“post” 时,则为新的一个 metric。标签中的键由 ASCII 字符,数字,以及下划线组成,且必须满足正则表达式 [a-zA-Z_:][a-zA-Z0-9_:]*。timestamp (时间戳):数据点的时间,表示数据记录的时间。Sample Value(采样值):实际的时间序列,每个序列包括一个 float64 的值和一个毫秒级的时间戳。
例如图上的数据:
http_requests_total {status="200",method="GET"}
http_requests_total {status="404",method="GET"}
根据上面的分析,时间序列的存储似乎可以设计成 key-value 存储的方式(基于 BigTable)。
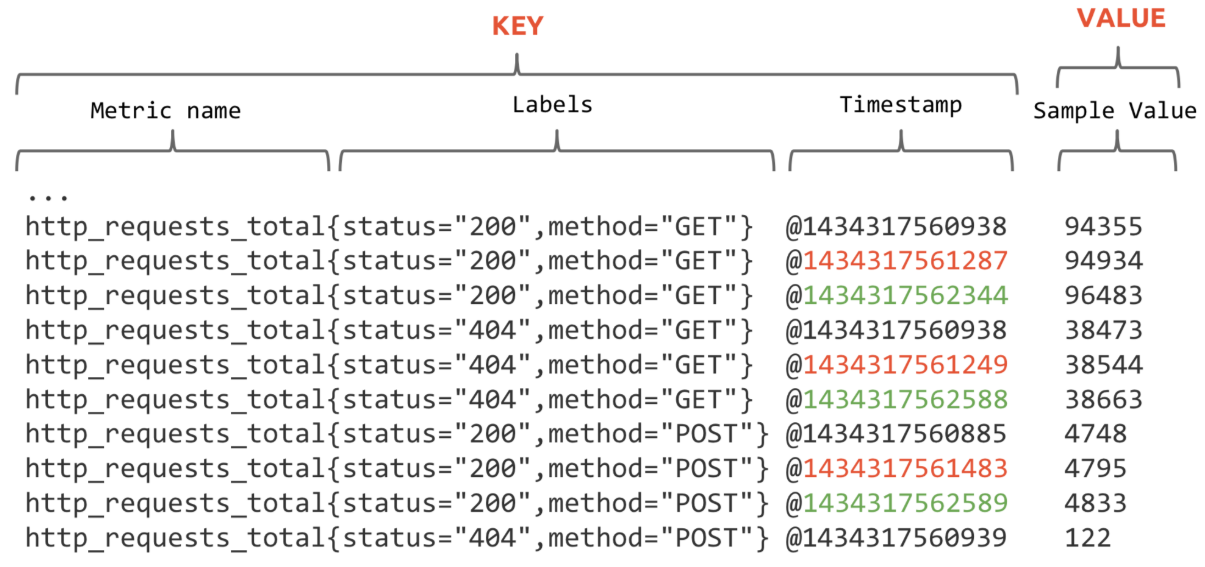
进一步拆分,可以像下面这样子:
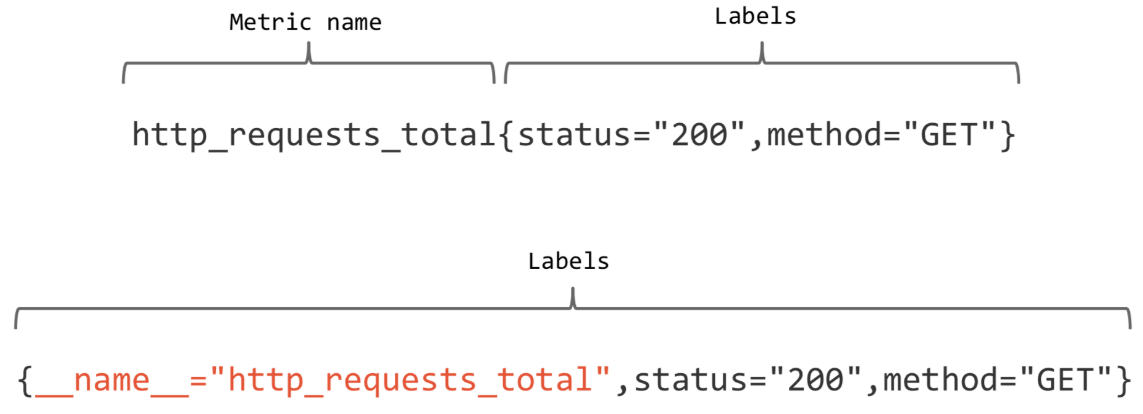
上图的第二条样式就是现在 Prometheus 内部的表现形式了,__name__ 是特定的 label 标签,代表了 metric name。
再回顾一下 Prometheus 的整体流程:
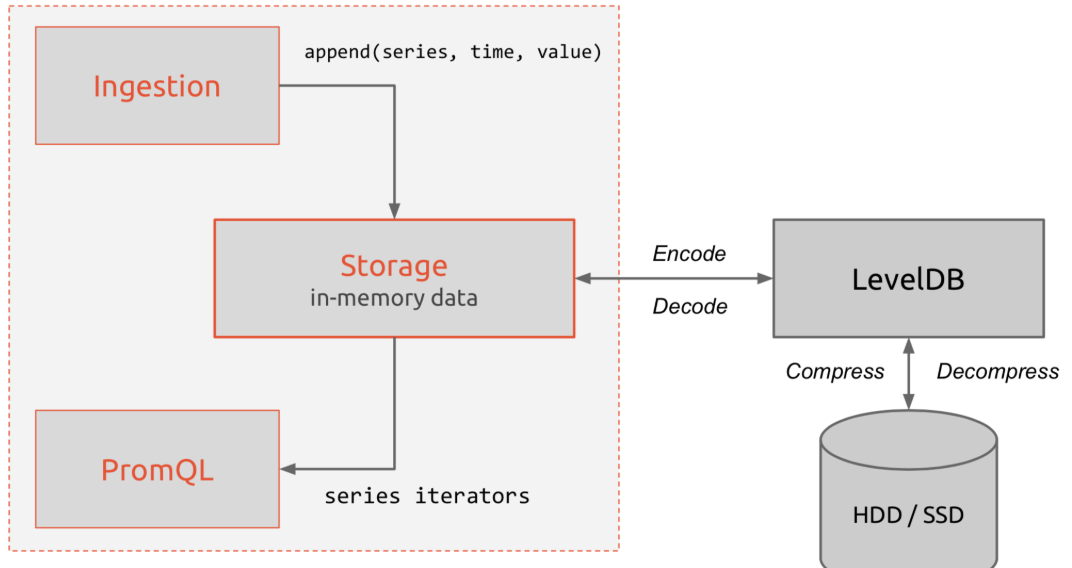
上面提到了 K-V 存储,当然是使用了 LevelDB 的引擎,它的特点是顺序读写性能非常高,这是非常符合时间序列的存储的。
1.3、Metric 类型
Prometheus 定义了 4 种不同的指标类型 (metric type):Counter(计数器)、Gauge(仪表盘)、Histogram(直方图)、Summary(摘要)。
1.3.1、Counter(计数器)
一种累加的 metric,典型的应用如:请求的个数,结束的任务数, 出现的错误数等等。
【例如】查询 http_requests_total {method=“get”, job=“Prometheus”, handler=“query”} 返回 8,10 秒后,再次查询,则返回 14。
1.3.2、Gauge(仪表盘)
数据是一个瞬时值,如果当前内存用量,它随着时间变化忽高忽低。
【例如】go_goroutines {instance=“172.17.0.2”, job=“Prometheus”} 返回值 147,10 秒后返回 124。
1.3.3、Histogram(直方图)
- Histogram 取样观测的结果(一般是请求持续时间或响应大小)并在一个可配置的分布区间(bucket)内计算这些结果。其也提供所有观测结果的总和。
- Histogram 有一个基本 metric 名称 ,在一次抓取中展现多个时间序列:
累加的 counter,代表观测区间:_bucket {le=“”}
所有观测值的总数:_sum
观测到的事件数量:_count
例如 Prometheus server 中 prometheus_local_storage_series_chunks_persisted, 表示 Prometheus 中每个时序需要存储的 chunks 数量,我们可以用它计算待持久化的数据的分位数。
1.3.4、Summary(摘要)
- 和 histogram 相似,summary 取样观测的结果(一般是请求持续时间或响应大小)。但是它还提供观测的次数和所有值的总和,它通过一个滑动的时间窗口计算可配置的分位数。
- Summary 有一个基本的 metric 名称 ,在一次抓取中展现多个时间序列:
观测事件的流式 φ- 分位数(0 ≤ φ ≤ 1):{quantile=“φ”}
所有观测值的总和:_sum
观测的事件数量:_count
例如 Prometheus server 中 prometheus_target_interval_length_seconds。
1.4、Histogram 和 Summary 的对比
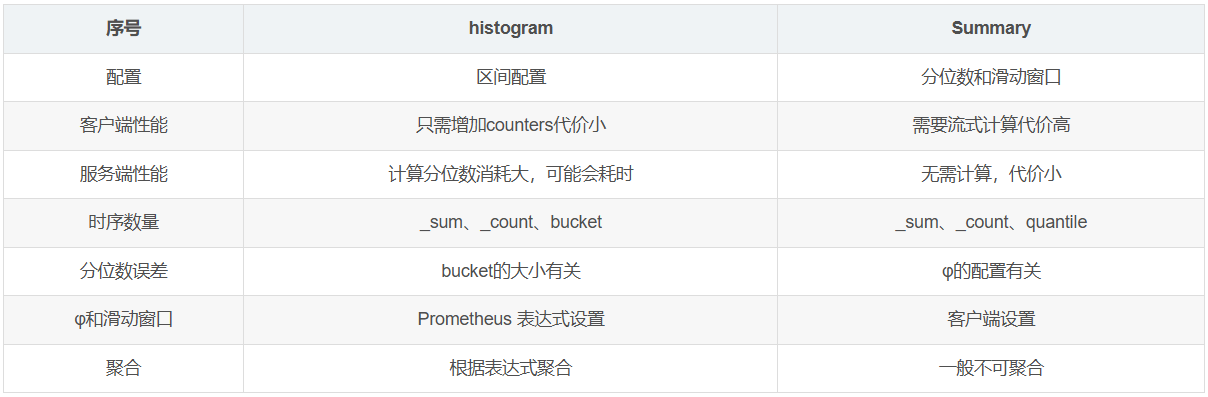
以下是类型为 histogram 和 summary 的样本输出示例:
# A histogram, which has a pretty complex representation in the text format:
# HELP http_request_duration_seconds A histogram of the request duration.
# TYPE http_request_duration_seconds histogram
http_request_duration_seconds_bucket {le="0.05"} 24054
http_request_duration_seconds_bucket {le="0.1"} 33444
http_request_duration_seconds_bucket {le="0.2"} 100392
http_request_duration_seconds_bucket {le="+Inf"} 144320
http_request_duration_seconds_sum 53423
http_request_duration_seconds_count 144320
# Finally a summary, which has a complex representation, too:
# HELP rpc_duration_seconds A summary of the RPC duration in seconds.
# TYPE rpc_duration_seconds summary
rpc_duration_seconds {quantile="0.01"} 3102
rpc_duration_seconds {quantile="0.05"} 3272
rpc_duration_seconds {quantile="0.5"} 4773
rpc_duration_seconds_sum 1.7560473e+07
rpc_duration_seconds_count 2693
1.5、任务(JOBS)与实例(INSTANCES)
用 Prometheus 术语来说,可以抓取的端点称为 instance,通常对应于单个进程。
具有相同目的的 instances 的集合(例如,出于可伸缩性或可靠性而复制的过程)称为 job。
例如,一个具有四个复制实例的 API 服务器作业:
job: api-server
instance 1: 1.2.3.4:5670
instance 2: 1.2.3.4:5671
instance 3: 5.6.7.8:5670
instance 4: 5.6.7.8:5671instance: 一个单独 scrape 的目标, 一般对应于一个进程。:jobs: 一组同种类型的 instances(主要用于保证可扩展性和可靠性)
1.6、Node exporter
Node exporter 主要用于暴露 metrics 给 Prometheus,其中 metrics 包括:cpu 的负载,内存的使用情况,网络等。
1.7、Pushgateway
Pushgateway 是 Prometheus 生态中一个重要工具,使用它的原因主要是:
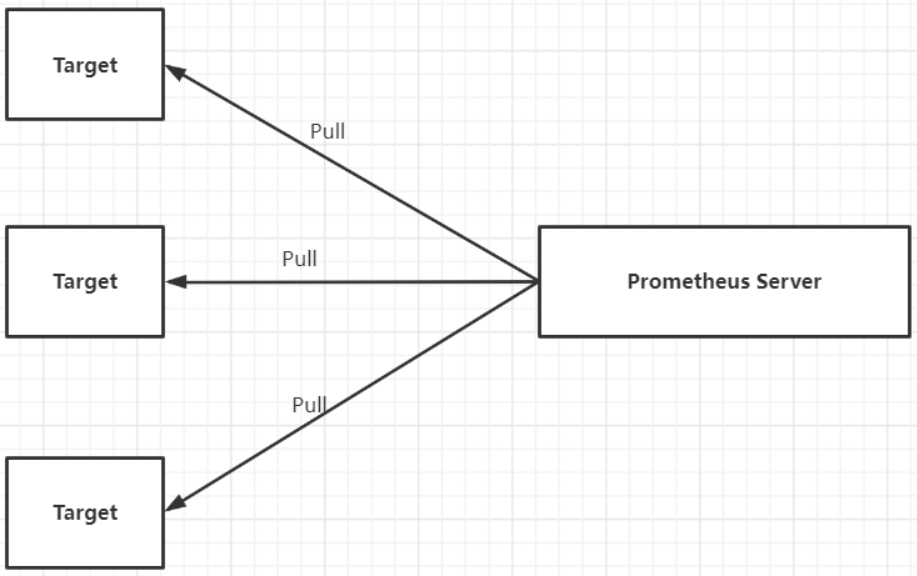
- Prometheus 采用 pull 模式,可能由于不在一个子网或者防火墙原因,导致 Prometheus 无法直接拉取各个 target 数据。
- 在监控业务数据的时候,需要将不同数据汇总,由 Prometheus 统一收集。
- 由于以上原因,不得不使用 pushgateway,但在使用之前,有必要了解一下它的一些弊端:
将多个节点数据汇总到 pushgateway, 如果 pushgateway 挂了,受影响比多个 target 大。
- Prometheus 拉取状态 up 只针对 pushgateway, 无法做到对每个节点有效。
- Pushgateway 可以持久化推送给它的所有监控数据。因此,即使你的监控已经下线,prometheus 还会拉取到旧的监控数据,需要手动清理 pushgateway 不要的数据。
二、Exporter 介绍
Exporter 是 prometheus 监控中重要的组成部分,负责数据指标的采集。广义上讲所有可以向 Prometheus 提供监控样本数据的程序都可以被称为一个 Exporter。而 Exporter 的一个实例称为 target。官方给出的插件有 blackbox_exporter、node_exporter、mysqld_exporter、snmp_exporter 等,第三方的插件有 redis_exporter,cadvisor 等。
官方和一些社区提供好多 exproter, 我们可以直接拿过来采集我们的数据。 官方的 exporter 地址:https://prometheus.io/docs/instrumenting/exporters/
2.1、常见的 Exporter 简介
1、blackbox_exporter
GitHub 地址:https://github.com/prometheus/blackbox_exporter
bloackbox exporter 是 prometheus 社区提供的黑盒监控解决方案,运行用户通过 HTTP、HTTPS、DNS、TCP 以及 ICMP 的方式对网络进行探测。这里通过 blackbox 对我们的站点信息进行采集。
2、node_exporter
GitHub 地址:https://github.com/prometheus/node_exporter
node_exporter 主要用来采集机器的性能指标数据,包括 cpu,内存,磁盘,io 等基本信息。
3、mysqld_exporter
GitHub 地址:https://github.com/prometheus/mysqld_exporter
mysql_exporter 是用来收集 MysQL 或者 Mariadb 数据库相关指标的,mysql_exporter 需要连接到数据库并有相关权限。
4、snmp_exporter
GitHub 地址:https://github.com/prometheus/snmp_exporter
SNMP Exporter 从 SNMP 服务中采集信息提供给 Promethers 监控系统使用。
2.2、Exporter 的来源
从 Exporter 的来源上来讲,主要分为两类:
1、社区提供
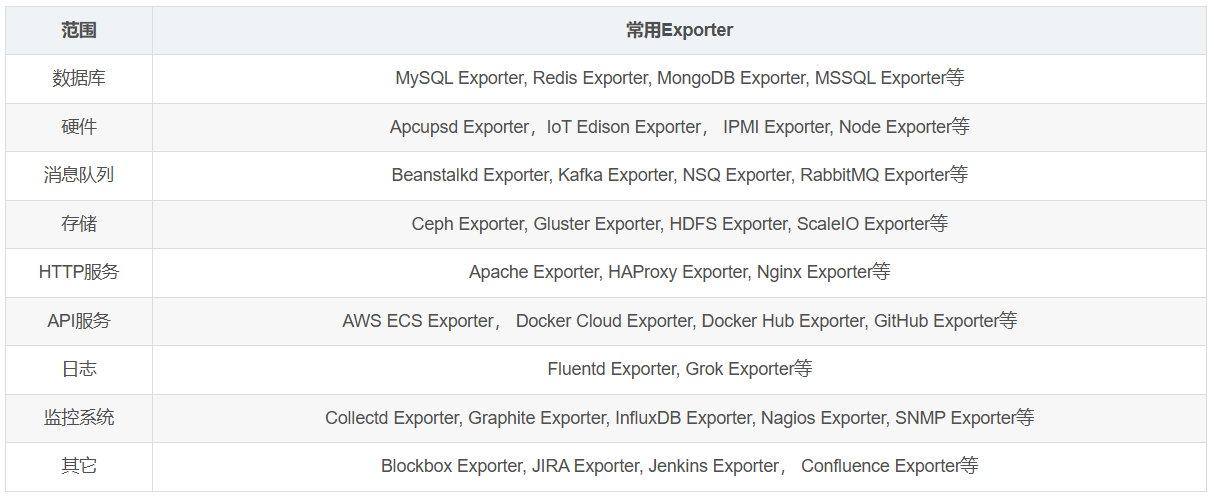
Prometheus 社区提供了丰富的 Exporter 实现,涵盖了从基础设施,中间件以及网络等各个方面的监控功能。这些 Exporter 可以实现大部分通用的监控需求。下表列举一些社区中常用的 Exporter:
2、用户自定义
除了直接使用社区提供的 Exporter 程序以外,用户还可以基于 Prometheus 提供的 Client Library 创建自己的 Exporter 程序,目前 Promthues 社区官方提供了对以下编程语言的支持:Go、Java/Scala、Python、Ruby。同时还有第三方实现的如:Bash、C++、Common Lisp、Erlang,、Haskeel、Lua、Node.js、PHP、Rust 等。
2.3、Exporter 的运行方式
从 Exporter 的运行方式上来讲,又可以分为:
1、独立运行
由于操作系统本身并不直接支持 Prometheus,同时用户也无法通过直接从操作系统层面上提供对 Prometheus 的支持。因此,用户只能通过独立运行一个程序的方式,通过操作系统提供的相关接口,将系统的运行状态数据转换为可供 Prometheus 读取的监控数据。 除了 Node Exporter 以外,比如 MySQL Exporter、Redis Exporter 等都是通过这种方式实现的。 这些 Exporter 程序扮演了一个中间代理人的角色(数据转换)。
2、集成到应用中(推荐)
为了能够更好的监控系统的内部运行状态,有些开源项目如 Kubernetes,ETCD 等直接在代码中使用了 Prometheus 的 Client Library,提供了对 Prometheus 的直接支持。这种方式打破的监控的界限,让应用程序可以直接将内部的运行状态暴露给 Prometheus,适合于一些需要更多自定义监控指标需求的项目。
2.4、Exporter 规范
所有的 Exporter 程序都需要按照 Prometheus 的规范,返回监控的样本数据。以 Node Exporter 为例,当访问 /metrics 地址时会返回以下内容:
# 取前面 10 行
$ curl -s -k --header "Authorization: Bearer $TOKEN" https://192.168.0.113:6443/metrics|head -10

# HELP aggregator_openapi_v2_regeneration_count [ALPHA] Counter of OpenAPI v2 spec regeneration count broken down by causing APIService name and reason.
# TYPE aggregator_openapi_v2_regeneration_count counter
aggregator_openapi_v2_regeneration_count {apiservice="*",reason="startup"} 0
aggregator_openapi_v2_regeneration_count {apiservice="k8s_internal_local_delegation_chain_0000000002",reason="update"} 0
aggregator_openapi_v2_regeneration_count {apiservice="v1beta1.metrics.k8s.io",reason="add"} 0
aggregator_openapi_v2_regeneration_count {apiservice="v1beta1.metrics.k8s.io",reason="update"} 0
# HELP aggregator_openapi_v2_regeneration_duration [ALPHA] Gauge of OpenAPI v2 spec regeneration duration in seconds.
# TYPE aggregator_openapi_v2_regeneration_duration gauge
aggregator_openapi_v2_regeneration_duration {reason="add"} 0.929158077
aggregator_openapi_v2_regeneration_duration {reason="startup"} 0.509336209
Exporter 返回的样本数据,主要由三个部分组成:样本的一般注释信息(HELP),样本的类型注释信息(TYPE)和样本。
Prometheus 会对 Exporter 响应的内容逐行解析:
- 如果当前行以# HELP 开始,Prometheus 将会按照以下规则对内容进行解析,得到当前的指标名称以及相应的说明信息:
# HELP <metrics_name> <doc_string> - 如果当前行以# TYPE 开始,Prometheus 会按照以下规则对内容进行解析,得到当前的指标名称以及指标类型:
# TYPE <metrics_name> <metrics_type> - TYPE 注释行必须出现在指标的第一个样本之前。如果没有明确的指标类型需要返回为 untyped。 除了
#开头的所有行都会被视为是监控样本数据。 每一行样本需要满足以下格式规范:
metric_name [
“{” label_name “=” "label_value" { “,” label_name “=” "label_value" } [ “,” ] “}”
] value [ timestamp ]
评论